
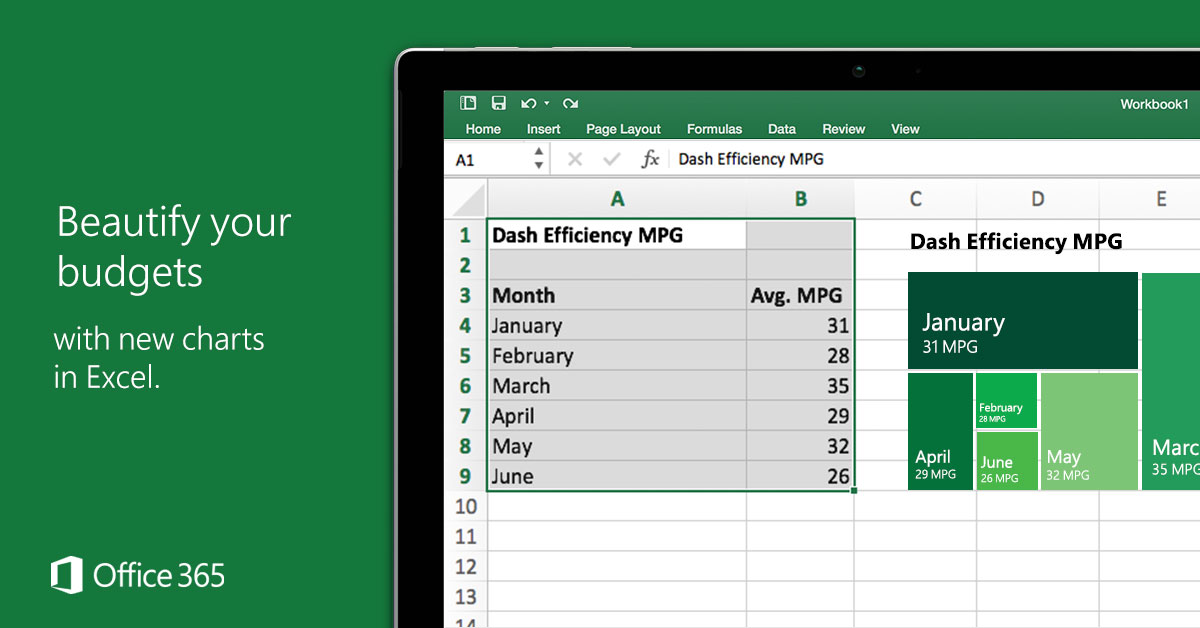
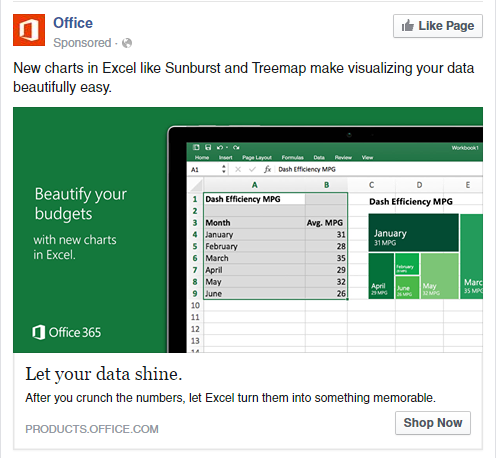
Microsoft’s Facebook ad for new features in Excel highlights the Treemap visualization, but gets it totally wrong.
A treemap is supposed to visualize relative size in a hierarchy. But in the illustration here, the data don’t fit this type of visualization (it’s a time series of one flat variable—without hierarchy).

But it’s even worse than that. The relative sizes don’t make sense! Why would the 31 MPG box for January be so much larger than the 32 MPG box for May?
This seems like a great illustration of why math/statistical education should be required for everyone—even visual designers and marketers. Or at least, the people selling the product should understand what the software actually does.